65% Chance Of A Post-Earnings Rise?

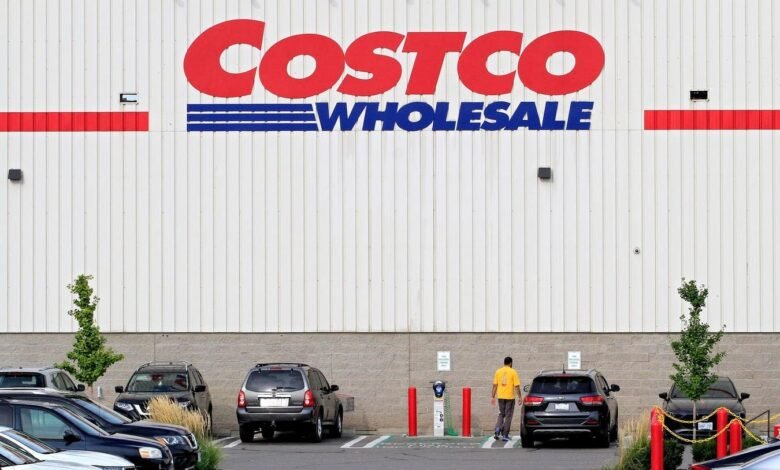
A shopper walks to a Costco store in Brampton, Ontario. The chain of membership-only warehouse club retail stores holds its Q4 2025 earnings call on September 25, 2025. (Photo by Mike Campbell/NurPhoto via Getty Images)
NurPhoto via Getty Images
Costco (NASDAQ: COST) is scheduled to release its fiscal fourth quarter 2025 results on Thursday, September 25. Analysts predict earnings of $5.81 per share on revenue of $86.11 billion, reflecting a 10% EPS increase and an 8% revenue growth compared to last year’s earnings of $5.29 per share on $79.70 billion. Historically, COST stock has increased after earnings 65% of the time, with a median one-day gain of 1.9% and a maximum movement of 7%. Also see Buy or Fear Costco Stock?
Costco exceeded expectations in Q3 FY2025, posting EPS of $4.28 (an increase of 13% year-over-year) on $63.2 billion in revenue (an increase of 8%), driven by 8% growth in comparable sales and a 16% jump in e-commerce. Although tariffs present risks, Costco’s size, bulk pricing, and low-cost approach may make it a likely beneficiary, with membership fee increases expected to significantly enhance results beginning in Q4 2025. Additionally, check out StubHub IPO: A Hot Ticket Or A Risky Bet?
The warehouse club operator holds a current market capitalization of $418 billion. Over the last twelve months, its revenue was $269 billion, and it maintained operational profitability with $10 billion in operating profits and a net income of $7.8 billion. While much will depend on how results compare to consensus and expectations, understanding historical trends may give an edge if you’re a trader focused on events.
There are two strategies to consider: either familiarize yourself with the historical probabilities and set your position before the earnings announcement, or analyze the relationship between immediate and medium-term returns following earnings and adjust your position accordingly afterwards. For those looking for a more stable alternative, the Trefis High Quality portfolio—which has gained 91% since its inception—has consistently outperformed the S&P 500. Collectively, HQ Portfolio stocks have delivered better returns with lower risks compared to the benchmark index, providing less volatility, as shown in HQ Portfolio performance metrics. See earnings reaction history of all stocks.
Costco’s Historical Odds Of Positive Post-Earnings Return
Some insights into one-day (1D) post-earnings returns:
- There have been 20 earnings data points documented over the last five years, with 13 positive and 7 negative one-day (1D) returns recorded. In summary, positive 1D returns occurred about 65% of the time.
- However, this percentage drops to 64% if we review data from the past 3 years instead of 5.
- Median of the 13 positive returns = 1.9%, and median of the 7 negative returns = -1.8%
Further data for observed 5-Day (5D) and 21-Day (21D) returns post earnings is compiled alongside the statistics in the table below.
COST Correlation Between 1D, 5D and 21D Forward Returns
Trefis
Correlation Between 1D, 5D, and 21D Historical Returns
A relatively safer strategy (though it may not be effective if the correlation is weak) is to analyze the relationship between short-term and medium-term returns following earnings, identify a pair that exhibits the highest correlation, and execute the corresponding trade. For instance, if 1D and 5D show the strongest correlation, a trader can position themselves “long” for the upcoming 5 days if the 1D post-earnings return is positive. Here is some correlation data derived from a 5-year and more recent 3-year framework. Note that the correlation 1D_5D refers to the relationship between 1D post-earnings returns and subsequent 5D returns.
COST Correlation Between 1D, 5D and 21D Historical Returns
Trefis
Is There Any Correlation With Peer Earnings?
At times, the performance of peers can impact the stock reaction following earnings. In fact, market pricing may commence before the actual earnings announcements. Below is some historical data comparing the post-earnings performance of Costco Wholesale stock to that of peers that reported their earnings just prior to Costco Wholesale. For a fair comparison, peer stock returns are also represented as post-earnings one-day (1D) returns.
Correlation with Peers
Trefis
Learn more about Trefis RV strategy that has outperformed its all-cap stocks benchmark (a combination of all three: the S&P 500, S&P mid-cap, and Russell 2000), delivering strong returns for investors.
Credit: Source link


