Buy Morgan Stanley Stock Ahead Of Earnings?

Morgan Stanley (NYSE:MS) is set to report its earnings on Wednesday, October 15, 2025. Earnings are projected to be $2.07, up from $1.88 in the year-ago period, while revenues are projected to grow by about 6.5% to 16.4 billion. The quarter’s results are likely to be driven by stronger trading revenue, with both equity and fixed-income segments likely to perform well. In addition, mergers and acquisitions activity is likely to pick up, along with higher underwriting fees, is anticipated to support the investment banking segment.
Image by 3D Animation Production Company from Pixabay
The company has $249 billion in current market capitalization. Revenue over the last twelve months was $62 billion, and net income of $15 billion. While a lot will depend on how results stack up against consensus and expectations, understanding historical patterns might just turn the odds in your favor if you are an event-driven trader. There are two ways to do that: understand the historical odds and position yourself prior to the earnings release, or look at the correlation between immediate and medium-term returns post earnings and position yourself accordingly after the earnings are released. That said, if you seek upside with lower volatility than individual stocks, the Trefis High Quality portfolio presents an alternative – having outperformed the S&P 500 and generated returns exceeding 105% since its inception.
See earnings reaction history of all stocks
Morgan Stanley’s Historical Odds Of Positive Post-Earnings Return
Some observations on one-day (1D) post-earnings returns:
- There are 19 earnings data points recorded over the last five years, with 12 positive and 7 negative one-day (1D) returns observed. In summary, positive 1D returns were seen about 63% of the time.
- Notably, this percentage increases to 64% if we consider data for the last 3 years instead of 5.
- Median of the 12 positive returns = 1.6%, and median of the 7 negative returns = -2.8%
Additional data for observed 5-Day (5D) and 21-Day (21D) returns post earnings are summarized along with the statistics in the table below.
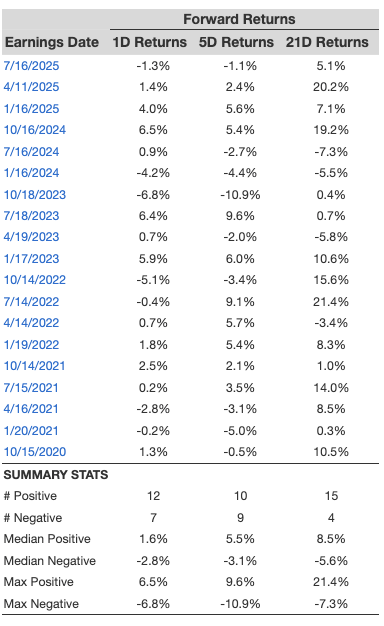
1D, 5D, and 21D Post Earnings Return
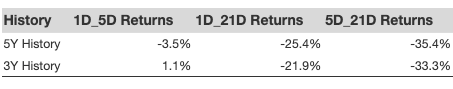
Correlation Between 1D, 5D and 21D Historical Returns
A relatively less risky strategy (though not useful if the correlation is low) is to understand the correlation between short-term and medium-term returns post earnings, find a pair that has the highest correlation, and execute the appropriate trade. For example, if 1D and 5D show the highest correlation, a trader can position themselves “long” for the next 5 days if the 1D post-earnings return is positive. Here is some correlation data based on a 5-year and a 3-year (more recent) history. Note that the correlation 1D_5D refers to the correlation between 1D post-earnings returns and subsequent 5D returns.
Correlation With Peer Earnings
Separately, if you want upside with a smoother ride than an individual stock like Morgan Stanley, consider the High Quality portfolio, which has comfortably outperformed its benchmark—a combination of the S&P 500, Russell, and S&P MidCap indexes—and has achieved returns exceeding 105% since its inception. Why is that? As a group, HQ Portfolio stocks provided better returns with less risk versus the benchmark index; less of a roller-coaster ride, as evident in HQ Portfolio performance metrics.
Invest with Trefis Market-Beating Portfolios
See all Trefis Price Estimates