Assessing NetApp’s Value After Recent Share Drop and Cloud Earnings Outlook in 2025

Thinking about whether to hang onto your NetApp shares, double down, or finally take some profits? You’re not alone. NetApp has always been a tech name that inspires lively debate, and the stock’s recent swings have only added to the suspense. Over the past year, shares have slipped by 8.4%, and the last month saw a 7.8% drop, but don’t let that short-term dip scare you off. If you take a step back, NetApp has delivered a whopping 172.7% return over the past five years, turning patient investors into true believers.
So, what’s driving these moves? Part of the story has to do with broader market shifts shaping investor risk appetites. This includes changing attitudes toward tech stocks, evolving competition, and the cloud’s growing influence. While NetApp’s year-to-date dip is modest at just 1.7%, those who have held on through the ups and downs have seen impressive long-term gains thanks to smart strategic pivots from legacy hardware to cloud-enabled solutions. The recent softness likely reflects a mix of market rotation and shifting expectations, rather than a sudden change in NetApp’s underlying fundamentals.
Of course, the big question hangs in the air: is NetApp actually undervalued right now? By our multi-check valuation analysis, NetApp scores a 5 out of 6, flagging it as undervalued on most counts. But before you rush to make a move, let’s dig into exactly what’s behind those numbers. Then we can explore a fresh way to look at what NetApp is really worth.
Why NetApp is lagging behind its peers
Approach 1: NetApp Discounted Cash Flow (DCF) Analysis
A Discounted Cash Flow (DCF) model estimates a company’s value by projecting its future cash flows and then discounting them back to today’s dollars. This method provides an intrinsic value that reflects what those future cash streams are really worth right now.
For NetApp, the most recent Free Cash Flow stands at about $1.65 billion. Analyst forecasts suggest modest annual growth, with Free Cash Flow expected to reach $1.91 billion by 2028. Extrapolating over a 10-year horizon, projections see cash flows growing further, with Simply Wall St estimating just under $2.5 billion by 2035. All cash flow figures are in US dollars.
Using these projections and the DCF methodology, NetApp’s intrinsic value is calculated at $179.19 per share. This figure is roughly 36.4% above the recent market price, which suggests that NetApp may be undervalued based on its long-term cash-generating ability.
Result: UNDERVALUED
Our Discounted Cash Flow (DCF) analysis suggests NetApp is undervalued by 36.4%. Track this in your watchlist or portfolio, or discover more undervalued stocks.
Approach 2: NetApp Price vs Earnings
For profitable companies like NetApp, the Price-to-Earnings (PE) ratio is a time-tested way to gauge whether a stock’s price matches its underlying performance. Since the PE ratio compares a company’s share price to its earnings per share, it is especially useful when a business has a consistent track record of generating profits, as NetApp does.
The “right” PE ratio is not one-size-fits-all. It is shaped by market expectations for future growth and by how much risk investors are willing to accept. Companies with higher growth prospects or lower perceived risk generally have higher PE ratios, while slower-growing or more volatile firms tend to trade at lower multiples. This is why it is always important to compare a company’s PE ratio not just to its own history, but also to the broader market and its direct peers.
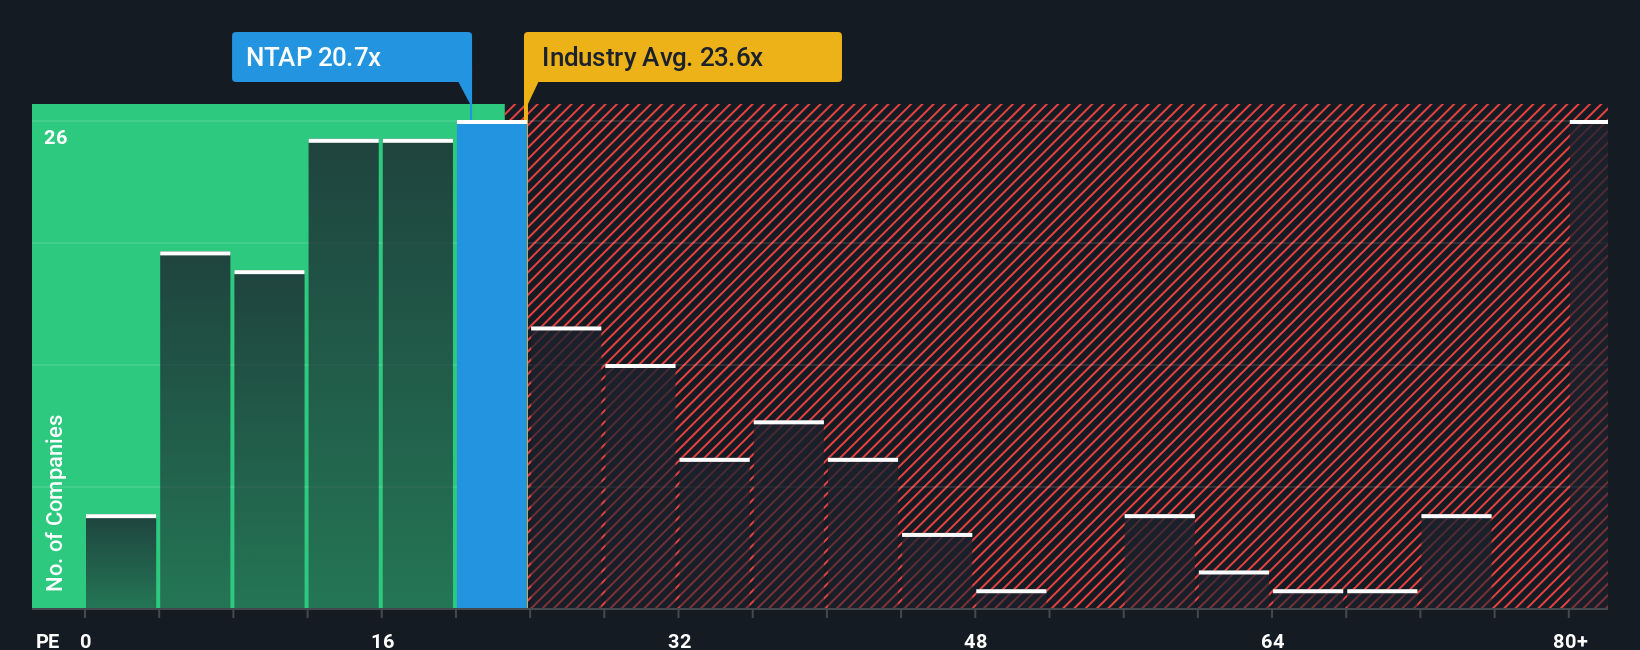
NetApp is currently trading at a PE ratio of 19.4x, which is below both the tech industry average of 23.8x and the peer group average of 23.3x. However, Simply Wall St’s proprietary “Fair Ratio” goes a step further. This Fair Ratio for NetApp is 27.8x, reflecting not just averages, but a more tailored view based on NetApp’s specific growth outlook, margins, market cap, and risk profile. Unlike a simple industry comparison, the Fair Ratio adjusts for unique strengths and weaknesses and offers a more precise fair value benchmark.
When comparing NetApp’s actual PE of 19.4x to its Fair Ratio of 27.8x, the stock appears significantly undervalued based on earnings multiples. This suggests there may be meaningful upside if the market recognizes NetApp’s intrinsic strengths and future prospects.
Result: UNDERVALUED
PE ratios tell one story, but what if the real opportunity lies elsewhere? Discover companies where insiders are betting big on explosive growth.
Upgrade Your Decision Making: Choose your NetApp Narrative
Earlier we mentioned there is an even better way to understand valuation, so let’s introduce you to Narratives. A Narrative is your personal, data-driven story about a company, combining your view of NetApp’s future with fair value estimates and forecasts for revenue, earnings, and profit margins. Instead of just relying on numbers, a Narrative links the company’s story to a forecast and a resulting fair value, letting you see how your perspective shapes what NetApp is really worth.
Narratives are designed to make investment decisions simpler and more dynamic. On Simply Wall St’s Community page, millions of investors use Narratives to share their views, compare fair values to current prices, and discover whether it might be the right time to buy or sell. What’s powerful is that Narratives update automatically as new information such as news or earnings comes in, so your analysis stays relevant.
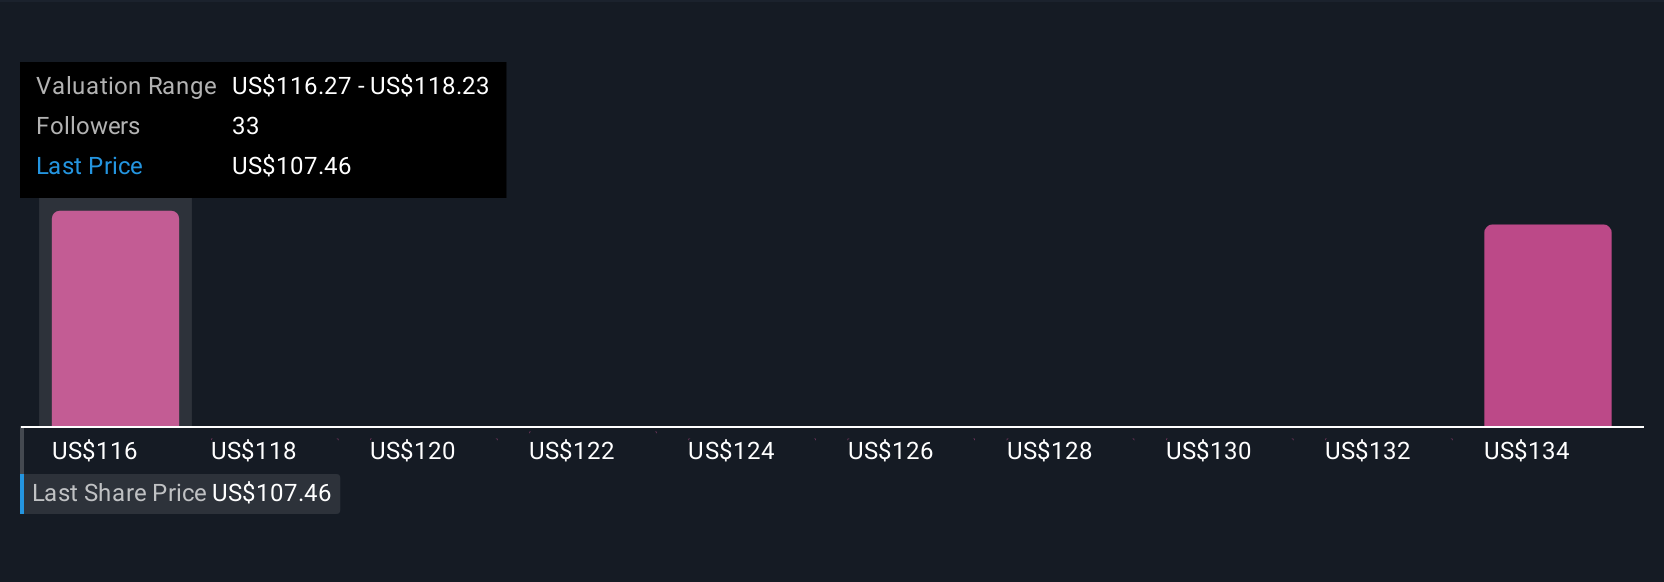
For example, some NetApp investors believe AI-driven cloud adoption will fuel double-digit growth, assigning a fair value as high as $130 per share, while more cautious investors, concerned about intense competition and margin pressure, see fair value closer to $100. With Narratives, you can develop and test your own conviction, and then act confidently on what you believe.
Do you think there’s more to the story for NetApp? Create your own Narrative to let the Community know!
This article by Simply Wall St is general in nature. We provide commentary based on historical data
and analyst forecasts only using an unbiased methodology and our articles are not intended to be financial advice. It does not constitute a recommendation to buy or sell any stock, and does not take account of your objectives, or your
financial situation. We aim to bring you long-term focused analysis driven by fundamental data.
Note that our analysis may not factor in the latest price-sensitive company announcements or qualitative material.
Simply Wall St has no position in any stocks mentioned.
Valuation is complex, but we’re here to simplify it.
Discover if NetApp might be undervalued or overvalued with our detailed analysis, featuring fair value estimates, potential risks, dividends, insider trades, and its financial condition.
Have feedback on this article? Concerned about the content? Get in touch with us directly. Alternatively, email editorial-team@simplywallst.com